
Selected work supporting high-stakes cost, pricing, and sourcing decisions.
Procurement Analytics & Cost Intelligence
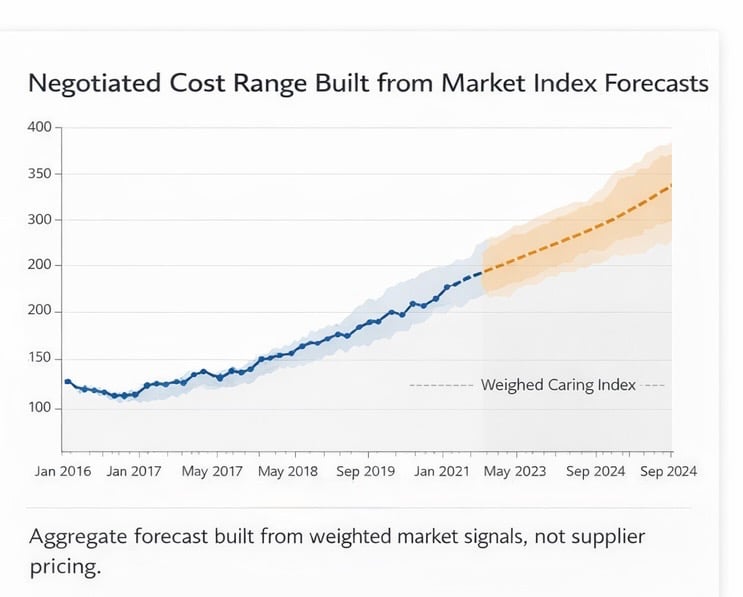
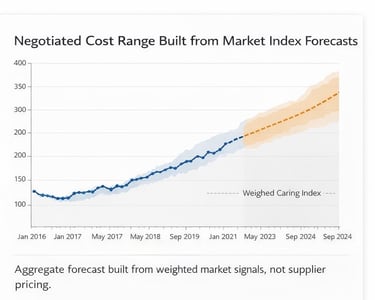
Driver-Based Cost Forecasting & Negotiation Ranging
Decision context
Leadership needed to understand where cost pressure was really coming from — and whether supplier price increases were economically justified or simply opportunistic.
Headline pricing trends were noisy, inconsistent, and difficult to defend in negotiations and internal approvals.
What we did
Built an aggregate cost index using multiple public market indices (Federal Reserve Economic Data, Statistics Canada, and category-relevant public sources)
Used category total system cost to identify which cost drivers had the greatest economic exposure and were most likely to influence overall cost movement
Applied algorithmic weighting approach to combine market indices into an aggregate signal, rather than relying on spend proportions alone
Validated index selection with business stakeholders to ensure no economically material cost drivers were missing — including indirect or embedded inputs (raw materials, fuels, utilities, storage, maintenance)
Developed forward-looking cost range based on weighted market signals and scenario analysis, rather than supplier-quoted pricing
Visualized results in a decision-ready format suitable for negotiations and approvals
Outcome
Replaced negotiation-by-anecdote with evidence-backed cost ranges
Enabled leadership to challenge blanket price increases using driver-level logic
Established a defensible economic baseline for negotiations, approvals, and internal alignment — before commitments were made
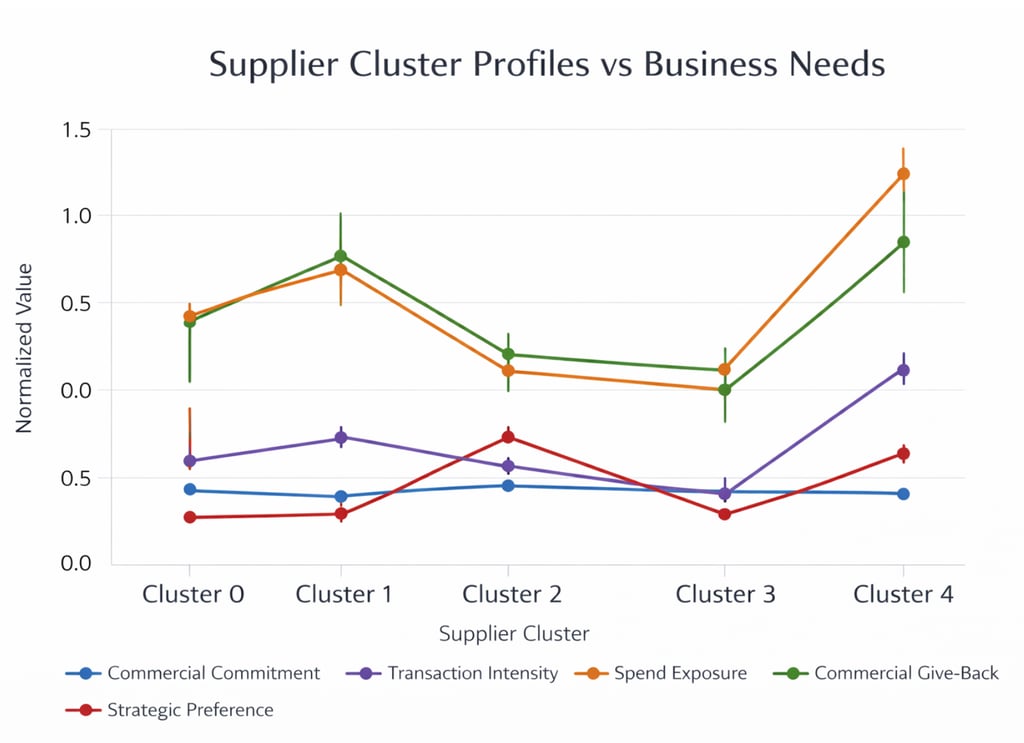
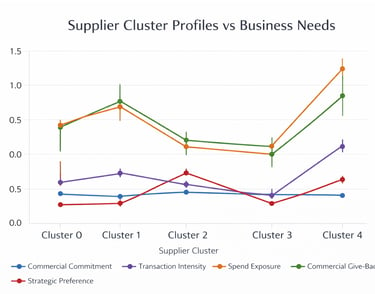
Supplier Pricing Prediction & Value Segmentation
Decision context
Procurement teams needed to understand why suppliers were pricing differently for similar assemblies — and whether observed price differences reflected real design complexity, supplier capability, or misalignment with business expectations.
The challenge was not ranking individual suppliers but understanding how different groups of suppliers trade off cost, performance, and commercial alignment when serving comparable assemblies.
What we did
Built a pricing feature set using procurement transactions, historical supplier quotes, and assembly design attributes rather than predefined should-cost models
Applied clustering and segmentation to group suppliers with similar cost-performance-alignment drivers
Summarized each cluster as a profile across key business criteria (cost exposure, delivery, safety, rebates, preference, and recency), enabling comparison of trade-offs rather than point-by-point supplier debates
Why it mattered
Shifted pricing discussions from quote-by-quote negotiation to pattern-based evidence at the portfolio level
Enabled leadership to distinguish:
Pricing driven by real design and operational complexity
Versus pricing driven by supplier behavior, commercial structure, or misalignment
Made visible which supplier profiles were:
Under-leveraged
Over-leveraged
Or representative of scalable best practice
Outcome
Procurement teams gained a clear, defensible view of how different supplier profiles performed relative to business needs, allowing them to benchmark pricing, prioritize supplier development or consolidation, and focus negotiations where the economic impact was highest.
Network Analysis & Market Intelligence
Pricing and Capacity Decisions Under Demand Uncertainty
Decision context
Pricing and availability decisions in short-term rental markets are rarely isolated. Changes made to one listing, location, or property type can influence demand and outcomes across a broader set of comparable listings.
Property owners and managers needed to understand where pricing, availability, and reinvestment decisions would have the greatest downstream impact, particularly in markets shaped by seasonality, substitution effects, and uneven demand concentration.
What we did
Built demand and availability features using historical booking behavior, listing characteristics, location attributes, and temporal signals
Used predictive models to estimate price and availability ranges under different demand scenarios, explicitly surfacing uncertainty rather than point estimates
Modeled interdependencies between listings and market segments based on similarity, substitution, and shared demand patterns
Represented these relationships as a network, where nodes reflected listings or segments and connections reflected demand overlap
Used network structure to identify high-influence hubs—areas where pricing, availability, training, or renovation decisions would disproportionately affect outcomes beyond a single listing
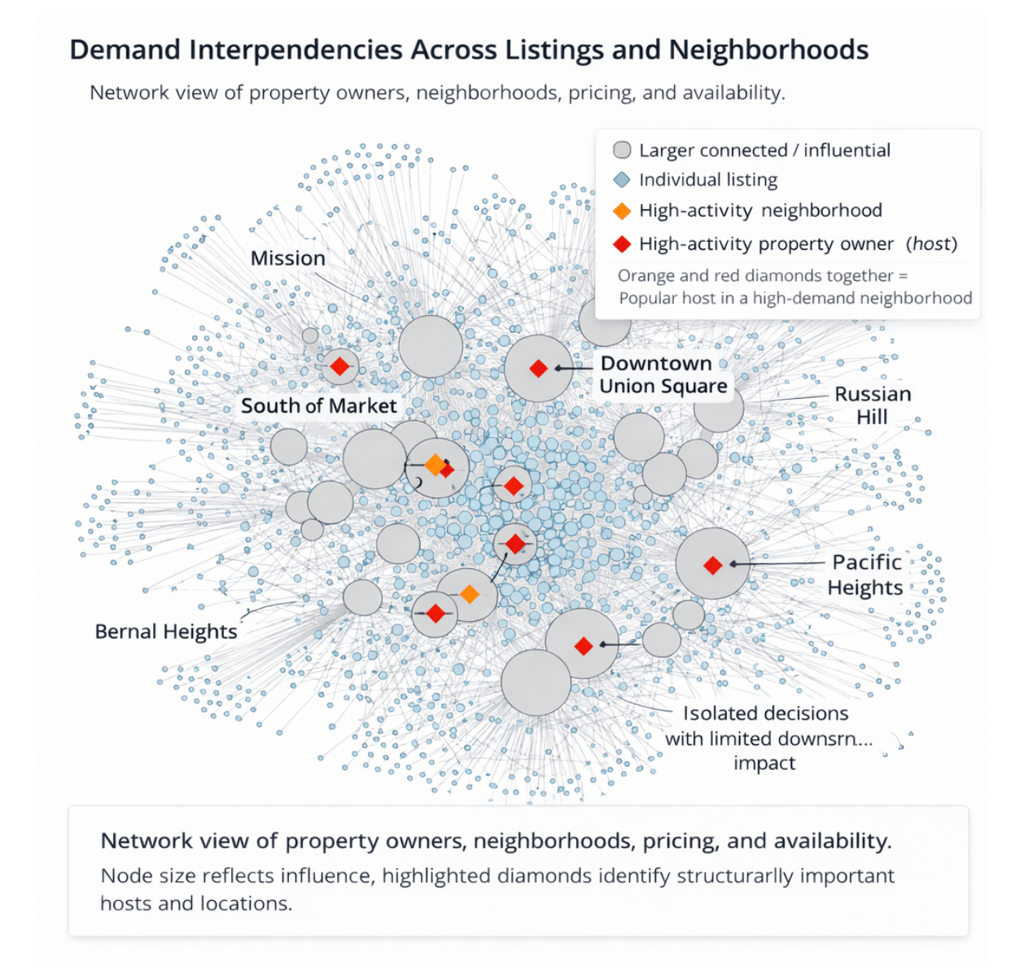
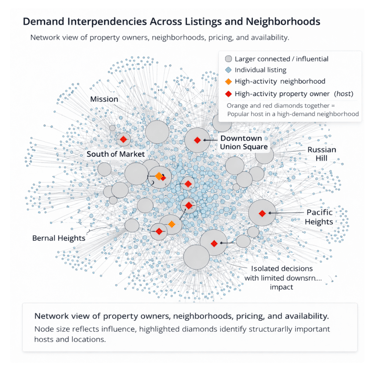
How to read this network
This network visualizes the relationships between property owners, neighborhoods, and listing activity.
Nodes represent entities (property owners, neighborhoods, listings).
Node size reflects influence — larger nodes indicate higher activity, stronger connectivity, or greater impact on pricing and availability.
Connections show relationships between owners and neighborhoods where listings are concentrated.
Diamond markers highlight dominant nodes:
Orange diamonds indicate high-activity neighborhoods.
Red diamonds indicate property owners with outsized influence (multiple listings, strong pricing power, or high availability concentration).
When both an owner and a neighborhood are highly connected, they appear together within dense clusters—signaling areas where pricing and availability are tightly coupled.
Why this matters
This structure makes it possible to see patterns that traditional tables and averages hide:
Which owners disproportionately influence supply and pricing
Which neighborhoods act as demand or pricing anchors
Where market power is concentrated, creating risk or opportunity
How this was used
Identified high-impact owners and neighborhoods requiring differentiated pricing, training, or policy treatment
Prioritized where to focus expansion, renovation, and availability efforts
Informed predictive models for rental pricing and availability by incorporating network influence rather than simple averages
Outcome
The network transformed a fragmented rental dataset into a decision-ready market map—allowing teams to focus attention where structural influence, not just volume, mattered most.
We’ve helped them
We've partnered with many household brand names to deliver insights and solutions to their problems with big data.
Happy clients
Don't just take our word for it – our clients frequently stay in touch with us and work with us on future projects that require big data insights.


John Bjerrand
I work in agricultural consulting, meaning that we often need to use big and complex datasets to justify expensive investments for our clients. Lilo's consultants helped us see the big picture with their visualization tools and expertise.


Anna Claudio
As the in-house supplier manager, it's sometimes had to understand which manufacturers work best for our needs. Lilo's data analysis helped us identify where we could save and which manufacturers worked the best for us in the long term.
Start a conversation
If you're facing an upcoming contract, sourcing decision, or negotiation and want an independent economic perspective, we can start with a focused conversation to determine whether BPS is the right fit.
Business Priority Services Inc.
Calgary, Alberta
info@bps-ai.com
© 2026 Business Priority Services Inc. All rights reserved.
Access market signals, cost intelligence insights, and procurement-focused updates from BPS.